Dashboard
The Dashboard is the project's home page: a real-time overview of executions and devices.
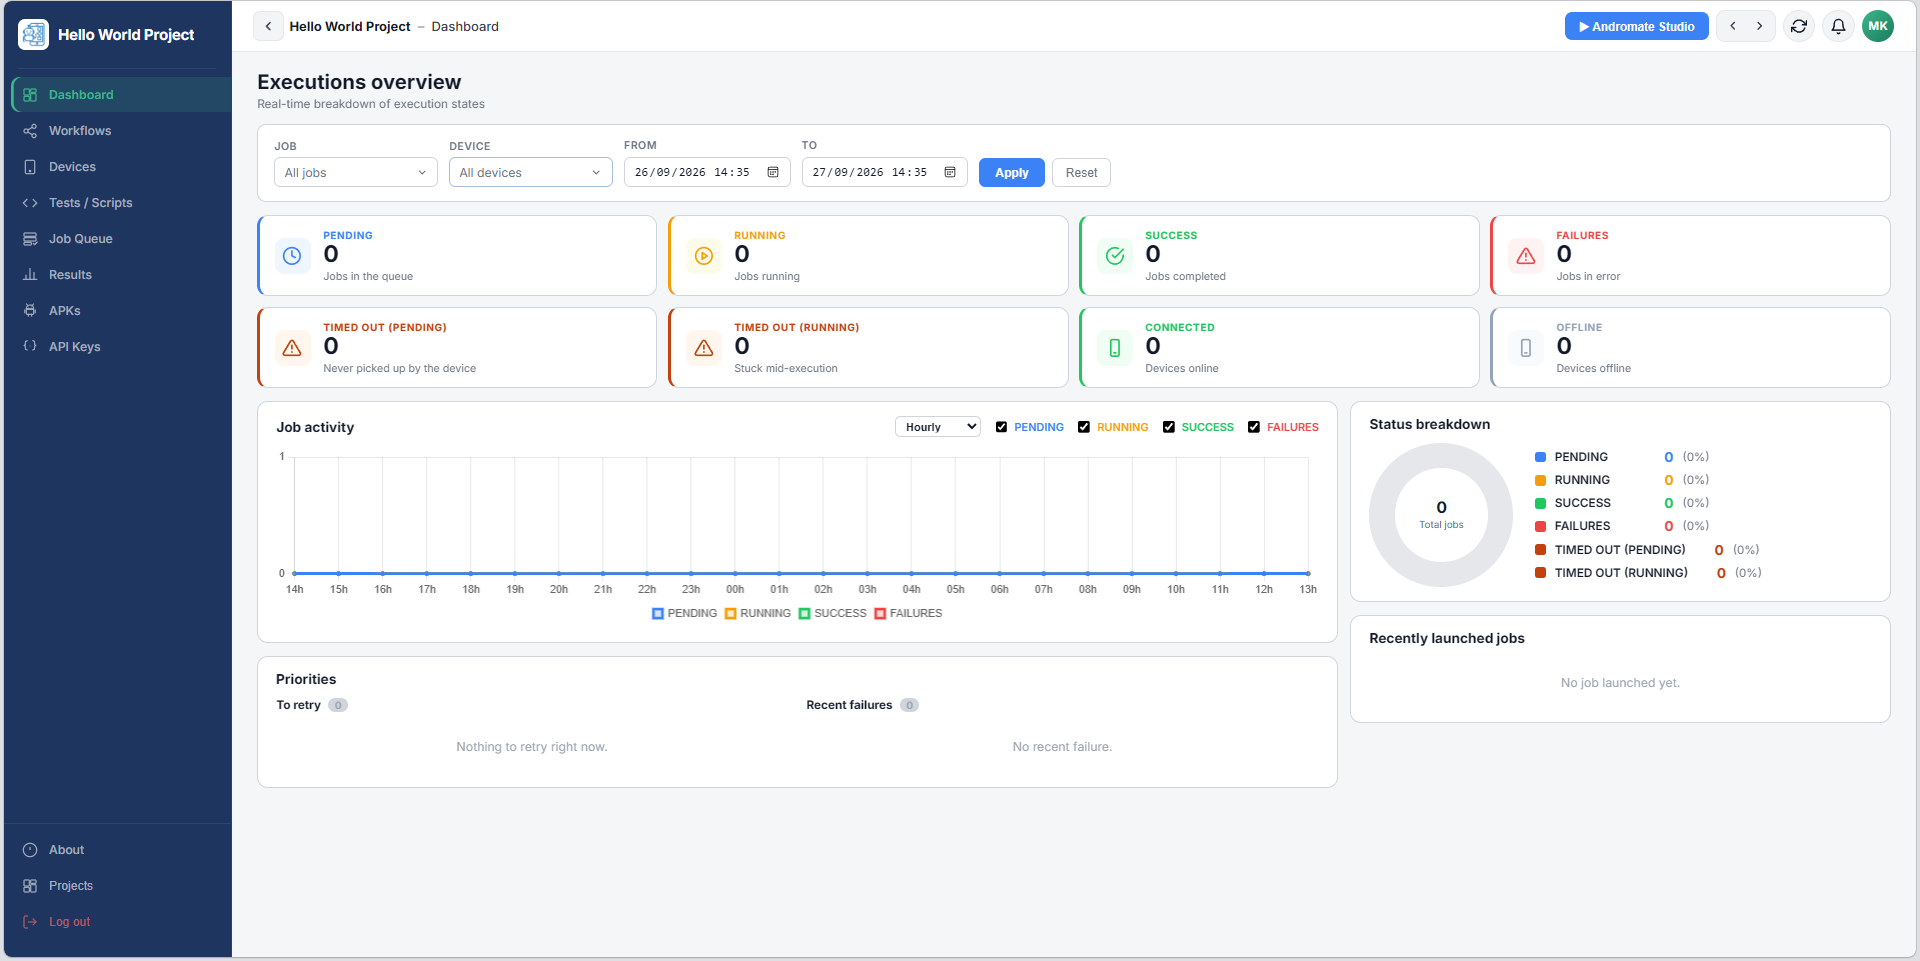
Filters
Job, Device, From and To narrow every card and chart below to a job, a device, or a time range. Click Apply to run the filter, or Reset to clear it.
KPI cards
| Card | Counts |
|---|---|
| Pending | Jobs in the queue, not started yet |
| Running | Jobs currently executing |
| Success | Jobs that completed successfully |
| Failures | Jobs in error |
| Timed out (Pending) | Jobs never picked up by the device |
| Timed out (Running) | Jobs stuck mid-execution |
| Connected | Devices currently online |
| Offline | Devices currently offline |
Job activity
An hourly chart of executions, broken down by state (Pending, Running, Success, Failures) - use the checkboxes above the chart to show or hide a state. The Status breakdown donut on the right gives the same breakdown as a percentage.
Priorities
Two quick-access lists: To retry (executions worth relaunching) and Recent failures - so you don't have to open Results to spot what needs attention.